Fiscal Intelligence and Reform Lab
Does Tax Technology Pay for Itself?
EFRIS and Digital Tax Stamps are compulsory for those they cover, and they cost someone money. An auditor would follow one thread from the money spent to the money raised. So we did.
Styled on an auditor's working papers. It is not an audit, and not a document of URA or the Auditor General. Published evidence only, read by TaxIntellilytics.
Scroll to walk the desk
1 of 8 Money spent
It should start here. There is nothing to tie it to.
A return begins with a cost. On each spike, one voucher is one cost line with anything on it: 2 of 5 for EFRIS, 2 of 5 for stamps. The hatched red slips are the rest.
What government paid to build and run either system is not in any public document we could read. A hole is not zero. It means not found.
2 of 8 In use
The thread begins where the counting begins
Each chip is 100 EFRIS users, in June 2024. 25,391 are on the free web portal, by far the tallest pile. Each stamp below them is one firm on Digital Tax Stamps: 143 at first, 925 by late 2022. Both systems are plainly in use, so the first knot holds.
3 of 8 In use
Now count invoices, and watch the pile move
The same chips now count a million invoices each. 486 million came from 4,257 users on system-to-system integration. The portal's 25,391 users issued 26 million. EFRIS is really two systems, and the evidence and the burden sit with different firms.
4 of 8 Behaviour changed
It holds here too, though stamps' thread runs thin
For firms mandated onto integration, reported VAT due rose 148%, while reported sales fell 39%. That is a strong study of one group, not of EFRIS as a whole.
For stamps, excise fell 24.8% in year one and rose 29.3% in year two, and that second interval touches zero. The author calls it suggestive, so the blue thread is drawn thin.
5 of 8 First yield
One sheet of paper is UGX 1 bn
URA's table for FY2019/20 expected UGX 170 bn from fiscal devices: the ghost stack. It records UGX 0.64 bn: the torn red scrap, about two-thirds of one sheet. For stamps, 150 bn expected, and nil.
That year began late and was cut short by COVID-19, so this tests the forecast, not the systems. It is the last place the tables we read name either one.
6 of 8 The actual page
Not our chart. URA's own page.
This is the table itself, Annex 3 of URA's Annual Revenue Performance Report for FY2019/20. Read the two rows under the glass: Electronic Fiscal Devices, 170.00 expected, 0.64 actual. Digital Tax Stamps, 150.00 expected, a dash.
The red ring is ours. Nothing else on the page has been touched.
7 of 8 Revenue raised
The thread runs out before the money
Collections rose 46% from FY2021/22 to FY2024/25, and nominal GDP 40%. The two stacks are to scale, with FY2021/22 as 100 sheets. The share of GDP moved from 13.31% to 13.88%.
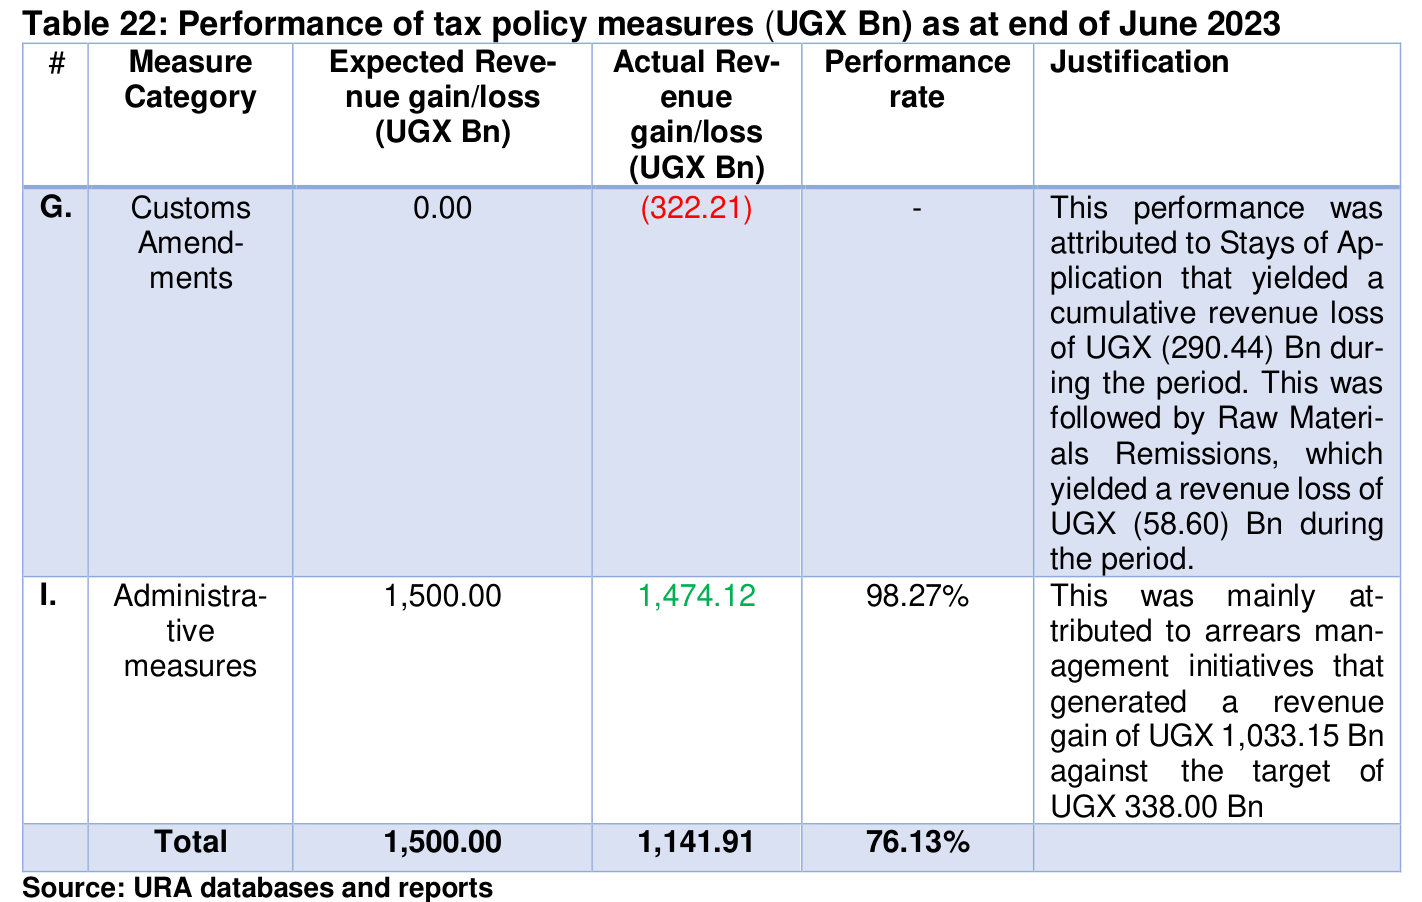
URA's own page for FY2022/23, on the desk beside them, credits arrears work with UGX 1,033.15 bn of its UGX 1,474.12 bn administrative gain. No published estimate says how much belongs to either system. So nothing here ties to the thread.
8 of 8 Return
So this line cannot be totalled
A return needs a cost at one end and a benefit caused by the system at the other. We have neither, for either system. That is not a finding that they failed. It is a finding that nobody outside government can yet say.
The whole desk
It holds in the middle. Neither end is tied.
Both are in use, and behaviour moved. But no published figure ties the thread to what was spent, or to what was raised. The file below sets out each link, with its sources, and what would tie it.
Or drag a loose end on the desk with your hand. It is the true length.
Open the fileLead schedule
| What a return would need | EFRIS | Digital Tax Stamps |
|---|---|---|
| 1 Build and run, to government B | Not found | Actual not foundFirst year projected at UGX 126.3 bn |
| 2 Contract price, and paid to the supplier B | Not found | Not found |
| 3 Cost to taxpayers BF | Devices: about UGX 2.9 bnIntegration not measured | Modelled at UGX 52 to 128 bn a year |
| 4 In use G | 43,244 firms in FY2024/25 | 96.48% of gazetted taxpayers reported compliant |
| 5 First official yield, FY2019/20 A | UGX 0.64 bn of 170 bn expected | Nil of 150 bn expected |
| 6 Later official yield A | Not found | Not found |
| 7 Best causal evidence DE | Strong on reporting for one group of firms | Suggestive for the first two years, with low power |
| 8 Return on investment BC | Cannot be totalled | Cannot be totalled |
- Agreed to an official document
- Recalculated by us
- Estimate with a stated design
- Our model: a range, not a measure
- Reported in the press, not a primary document
- Seen only second-hand, not yet verified
- Looked for and not found. Not zero, and not a finding that anything is wrong.
W/P A
First yieldThe first promises ran far ahead of delivery, then the official count stops
URA's own table for FY2019/20 sets what each measure was expected to raise against what it records. All administrative measures reached 8.39% of target.
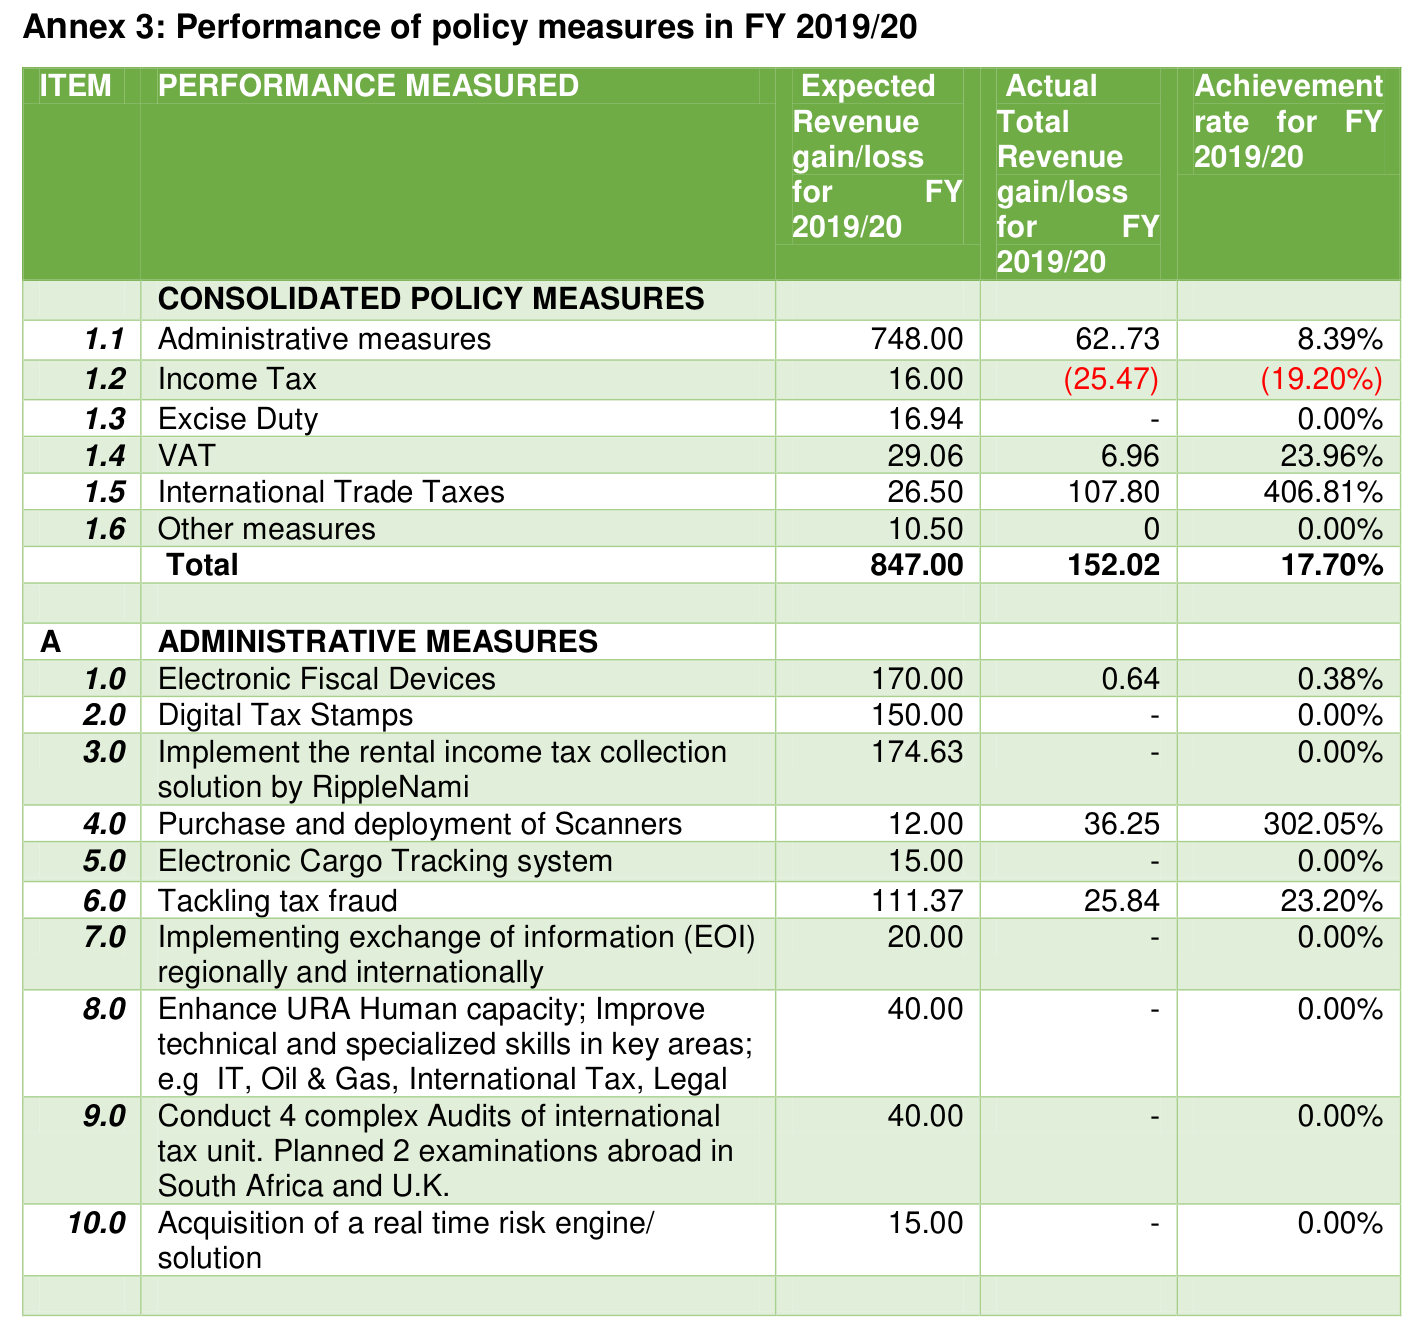
This tests the forecast, not the systems. Stamps began only in November 2019, EFRIS was piloted in May 2020, and COVID-19 cut the year short. We do not know how URA measured the gain. And the forecast itself was not settled: URA's table says UGX 150 bn for stamps, while the Commissioner General reportedly told Parliament to expect UGX 47.7 bn instead.
After that, the count stops. In the reports we read for FY2020/21 to FY2022/23, tables give administrative gains only in total. For FY2022/23, URA credits arrears management with UGX 1,033 bn of UGX 1,474 bn, and calls EFRIS and stamps “major sources of information”, with no figure. We could not reach URA's reports for FY2023/24 and FY2024/25, so a figure may exist there.
W/P B
Money spentTen cost lines, and most of the slots are empty
A return starts with a cost. We listed every cost we could name, for government and for taxpayers. Empty does not mean zero, and it does not mean anything was hidden. It means we did not find it in public documents.
EFRIS
Digital Tax Stamps
Tap a slot to read it.
URA's budget does not help, as it is not split by system. In FY2024/25, it spent UGX 47.4 bn of a development budget of UGX 57.4 bn, with nothing to say how much went on either one. Our request to URA for these lines is drafted.
W/P C
Revenue raisedCollections rose about as fast as the economy
The rise in collections is often the first evidence offered for digital reform. Try it three ways, and from three starting years.
Collections rose 46% and nominal GDP 40%. Much of the rise in shillings tracks a larger economy in nominal terms. The first full year after mandatory invoicing began, and the start used in our findings.
Whichever start you pick, the headline figure cannot be evidence for either system by itself. This neither proves nor rules out a contribution. It only says that collections rising is not a return. W/P H lists what else has to be ruled out.
Back to line 8 of the lead schedule
W/P D
Behaviour changedEFRIS changed what its most tightly bound firms report
Lees and colleagues compare 3,511 firms mandated onto system-to-system integration from April 2022 with 5,931 others, using synthetic difference-in-differences, to June 2023. Tap a line to read it.
VAT due: +148% (95% interval +81% to +240%). What firms report owing. Much of this rise comes from smaller carried-forward credits, not from more VAT on sales.
Fake or inflated input claims became harder, which is a real result. But it is not the same as more revenue: reported sales fell too, and the research brief speaks of “limited short-term revenue effects”. It also does not measure EFRIS as a whole, as all VAT firms were mandated at once, so there is no comparison group for that. About 12,000 first-time VAT filers coincided with EFRIS and enforcement, and the paper does not claim to have caused them. These authors include URA staff. Their own advice is not to mandate this for all firms, as smaller firms may not manage the cost.
Back to line 7 of the lead schedule
W/P E
Behaviour changedStamps: down in the first year, perhaps up in the second
Namunane compares treated and other excisable firms over 517 firms and stops at FY2020/21. In the first year government paid for the stamps, and in the second firms did.
At 95%, year two runs from -2% to +61%, which includes zero. It clears zero at 90% and touches it at 95%, which is why the author calls this suggestive.
The author warns of low power and possible pre-trends, and we repeat the warning. Since then, firms on stamps have grown from 143 to 925, and URA raised UGX 24.25 bn of assessments from stamp data in FY2022/23. Those show use, not revenue caused. No later study covers the wider products.
Back to line 7 of the lead schedule
W/P F
Money spentThe stamp bill firms carry, as far as a model can say
Manufacturers and importers buy the stamps. Nobody publishes the bill, so we modelled one for FY2024/25. Move a pack size and see how far it travels.
Stamps have become cheaper
The direction is clear, even if the size of the bill is not. Below, prices from FY2019/20 to FY2024/25 on a log scale.
A 2026 press report gives lower prices still, and it conflicts with URA's guide. We have not used it. Comparisons with other countries' stamp prices are in dispute, so we do not publish one.
Back to line 3 of the lead schedule
W/P G
In useEFRIS is really two systems
The evidence and the burden sit with different firms. In June 2024, 13% of users issued 94% of invoices, and these are the firms W/P D studies. The web portal has 79% of users, and 5% of invoices. In a survey fielded during the 2024 traders' strike, 51% of firms reported harm from EFRIS enforcement.
The fiscal device barely happened: 13% of the 20,000 planned had been bought by June 2023. EFRIS adoption holds the detail.
Back to line 4 of the lead schedule
W/P H
Revenue raisedWhat else has to be ruled out
Before any rise is credited to a system. None of these is separated from EFRIS or stamps in official reporting.
- A larger economy
- Nominal GDP rose 40% from FY2021/22 to FY2024/25. See W/P C.
- Inflation
- Part of that nominal rise is prices, which raises collections with no change in compliance.
- New tax measures
- Changes in the tax amendment Acts over the same years raise revenue on their own.
- Arrears work
- URA's own main attribution for FY2022/23. See W/P A.
- Audits and enforcement
- These came with both systems, and cannot be separated from the technology itself.
W/P J
Beside the trailSimpler alternatives, as questions
A fair appraisal asks what else could have done the job. These are not recommendations, and none has a costed comparison.
| For | Alternative to weigh | Safeguard it might lose |
|---|---|---|
| EFRIS, smaller firms | A free point-of-sale bridge, as Lees and colleagues suggest | Some of the monitoring strength of full integration |
| EFRIS, smaller firms | E-invoices required only above a turnover line | Coverage of their sales to VAT-registered buyers |
| Stamps, lower-risk goods | Production reconciliation and audit, without a stamp | Consumer verification, and track and trace |
| Stamps, all goods | A lower, uniform price, as Namunane suggests | The supplier's cost recovery under the contract |
Risks on record: dependence on one supplier, single-sourced with terms not public, and a five-year term from October 2018 whose renewal we could not confirm. Exclusion through digital skills, connectivity and a UGX 1.1m device. Privacy and security were not assessed here.
Our opinion, line by line
Borrowed from audit. Clean means the evidence supports it. Qualified means it does, with limits. Disclaimed means there is not enough evidence to say either way. A disclaimer is not a finding against a system. These are our words about published evidence, and they speak for no auditor.
| Question | EFRIS | Digital Tax Stamps |
|---|---|---|
| Is it in use? | Clean43,244 firms used it in FY2024/25, and growing. | Clean96.48% of gazetted taxpayers reported compliant, on URA's measure. |
| Did behaviour change? | QualifiedStrong on reporting, for mandated firms only. | QualifiedPossibly. Suggestive evidence, first two years, low power. |
| Did it raise revenue? | DisclaimedNo whole-system estimate exists, and no comparison group could give one. | DisclaimedDown in year one, perhaps up in year two, and nothing after FY2020/21. |
| Was it worth the cost? | DisclaimedThe cost to government is not public. | DisclaimedThe contract price and payments are not public. |
You did not mark an answer before reading. That is allowed.
Open items: what would fill the blanks
| Document | Could fill | Status |
|---|---|---|
| The Auditor General's reports | Lines 1, 2, perhaps 6 | Listed, not read. We could not open the site securely |
| URA's revenue reports, FY2023/24 and FY2024/25 | Line 6 | Not reached |
| URA's reply on lifecycle costs | Lines 1, 2, 3 | Request drafted, not sent |
| URA's “EFRIS Compliance and Cost Assessment Report (2023)” | Line 3 | Cited elsewhere. Not found, and we cannot confirm it exists as described |
| A later causal study, for stamps or the wider EFRIS rollout | Line 7 | None found |
When one of these arrives, its cell loses the hatching and gets a dated tick. If you hold one, the file can take it.
Sources and method
Figures are transcribed with source and page, and recomputed by tests. Aggregates only: no taxpayer records, no firm-level data. Net collections are from this site's dataset, and GDP is nominal. Percentages in W/P D convert the published coefficients. Those in W/P E are as the author reports them. Updated 5 November 2026.
- The Uganda Revenue Authority Electronic Fiscal Receipting and Invoicing System (EFRIS) data (WIDER Technical Note 2026/4). UNU-WIDER; Lees, Jouste, Kalyowa, Musoke, Okello, 2026.
- The panopticon taxman: the impact of e-invoicing on VAT compliance in Uganda (WIDER Working Paper 2025/112). UNU-WIDER; Lees, Jouste, Musoke, Okello, 2025.
- Annual Revenue Performance Report FY2019/20. Uganda Revenue Authority, 2020.
- Annual Revenue Performance Report FY2022/23. Uganda Revenue Authority, 2023.
- Vote 141 Uganda Revenue Authority, Vote Performance Report, Quarter 4, FY2024/25. Ministry of Finance, Planning and Economic Development, 2025.
- Domestic Revenue Mobilization Strategy Semi-Annual Monitoring Report FY2022/23. Ministry of Finance, Planning and Economic Development, 2023.
- Excise taxes and digital tax stamps: do digital tax stamps work? (IGC Working Paper UGA-22001). International Growth Centre; Namunane, 2022.
- A Simplified Guide on Digital Tax Stamps (DTS), Vol 1, Issue 3, FY2024/25. Uganda Revenue Authority, 2024.
- MPs want URA's digital stamp project probed. The Independent (Uganda), 2019.
- Uganda Business Climate Index, April to June 2024. Economic Policy Research Centre, 2024. Seen only second-hand.